There are different sets of information available to you once the AI has processed your search terms. Learn how to quickly read results using the different panels.
The Central panel is where you will see the results of your searches appear.
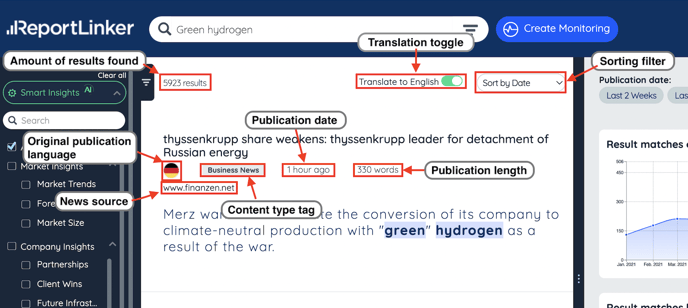
The number in the top left corner of the results panel indicates the number of results the AI has found. The count stops above 10 thousand hits, and will only display 10K+.
If you have purchased languages as an option, you will also see on the top right section of the result panel a toggle to translate your results into English. The results will all be translated with a flag displayed so you can quickly see the original result it was published in.
Results will by default be sorted by relevance. Relevance is a combination of the keywords you have typed and the freshness of the publications. You can also choose to sort the results by date, so you have an overview of the freshest publications available.

Business news: published news related to your search terms.
⚠️ Business news will be deduplicated so the amount of results is not affected by the redundancy of one news topic. For example: if McKinsey publishes a new study on digital transformation, it will surely be announced by different news providers. ReportLinker will only choose one article announcement to display.
Reports: can be any type of publicly published report.
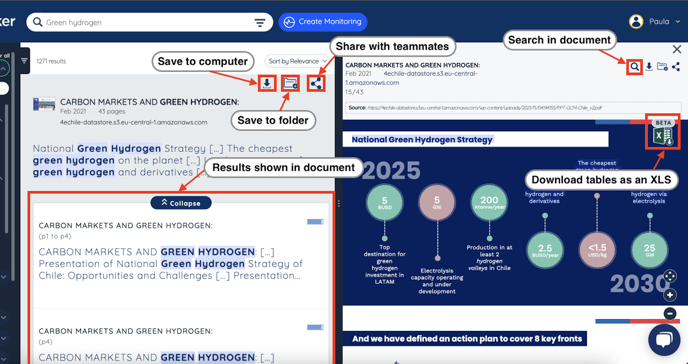
The results panel will display the date it was published, its number of pages and its source. By clicking on the report, you will be brought to the exact place in the document where your search term has been found. If the report includes data sets, you can download them from the report, by clicking on the "Extract tables from this page" Excel icon.

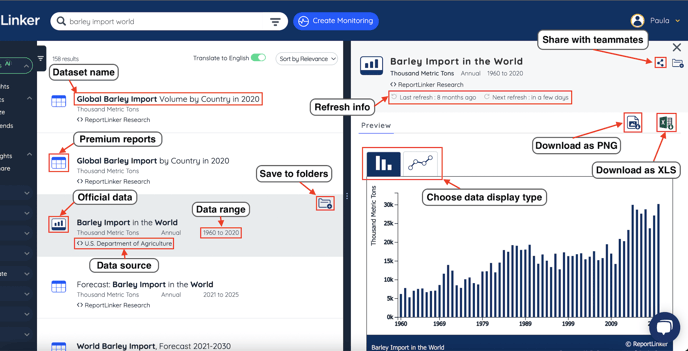
Data sets: display premium ReportLinker data or official data. You can download the available information as PNG files with graphs or as XLS documents that you can work on.
